Highcharts .Net is a charts library written in pure javascript, offering an easy way to add complex charts to your Web application. Highcharts .Net encapsulates the Highcharts API on ASP.net controls making it easier to use.
Project page at codeplex: http://highcharts.codeplex.com
You can see some Highcharts.Net examples at this link: http://highcharts.paulovich.com.br/
Install:
After download the newest release, add it as reference on your web application, and then add it to the page controls on your web.config:
[xml]
<pages controlRenderingCompatibilityVersion="3.5" clientIDMode="AutoID">
<controls>
<add tagPrefix="highchart" namespace="Highchart.UI" assembly="Highchart"/>
</controls>
</pages>
[/xml]
After that, you only need to import the jQuery script.
[xml]<script src="http://ajax.googleapis.com/ajax/libs/jquery/1.3.2/jquery.min.js" type="text/javascript"></script>[/xml]
it’s ready to use 😉
aspx:
[xml]
<highchart:columnchart id="hcVendas" width="600" height="400" runat="server"></highchart:columnchart>
[/xml]
VB Sample:
[vbnet]
Imports Highchart.Core
Partial Class Teste01
Inherits System.Web.UI.Page
Protected Sub Page_Load(sender As Object, e As System.EventArgs) Handles Me.Load
‘Eixo Y————————————————————————–
Dim YItem As New YAxisItem
With YItem
Dim tituloY As New Highchart.Core.Title("EIXO Y")
YItem.title = tituloY
hcVendas.YAxis.Add(YItem)
End With
‘Eixo X————————————————————————–
Dim XItem As New XAxisItem
With XItem
Dim tituloX As New Highchart.Core.Title("EIXO X")
XItem.title = tituloX
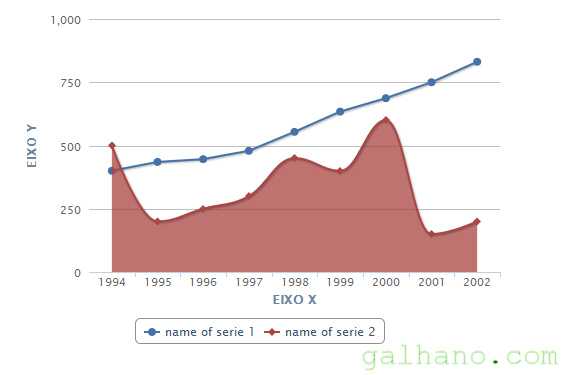
Dim categorias As Array = {"1994", "1995", "1996", "1997", "1998", "1999", "2000", "2001", "2002"}
XItem.categories = categorias
hcVendas.XAxis.Add(XItem)
End With
‘New data collection ————————————————————-
Dim series As New Highchart.Core.SerieCollection
Dim serie1 As New Highchart.Core.Data.Chart.Serie
serie1.data = {400, 435, 446, 479, 554, 634, 687, 750, 831}
serie1.type = RenderType.line
serie1.name = "name of serie 1"
‘serie1.color = "khaki"
series.Add(serie1)
Dim serie2 As New Highchart.Core.Data.Chart.Serie
serie2.data = {500, 200, 250, 300, 450, 400, 600, 150, 200}
serie2.type = RenderType.areaspline
serie2.name = "name of serie 2"
series.Add(serie2)
‘bind
hcVendas.DataSource = series
hcVendas.DataBind()
End Sub
End Class
[/vbnet]