Scott Gu blogged about the the free Microsoft Chart Controls for Microsoft .NET 3.5.
Microsoft recently released a cool new ASP.NET server control – <asp:chart /> – that can be used for free with ASP.NET 3.5 to enable rich browser-based charting scenarios:
- Download the free Microsoft Chart Controls
- Download the VS 2008 Tool Support for the Chart Controls
- Download the Microsoft Chart Controls Samples
- Download the Microsoft Chart Controls Documentation
- Visit the Microsoft Chart Control Forum
Once installed the <asp:chart/> control shows up under the “Data” tab on the Toolbox, and can be easily declared on any ASP.NET page as a standard server control:
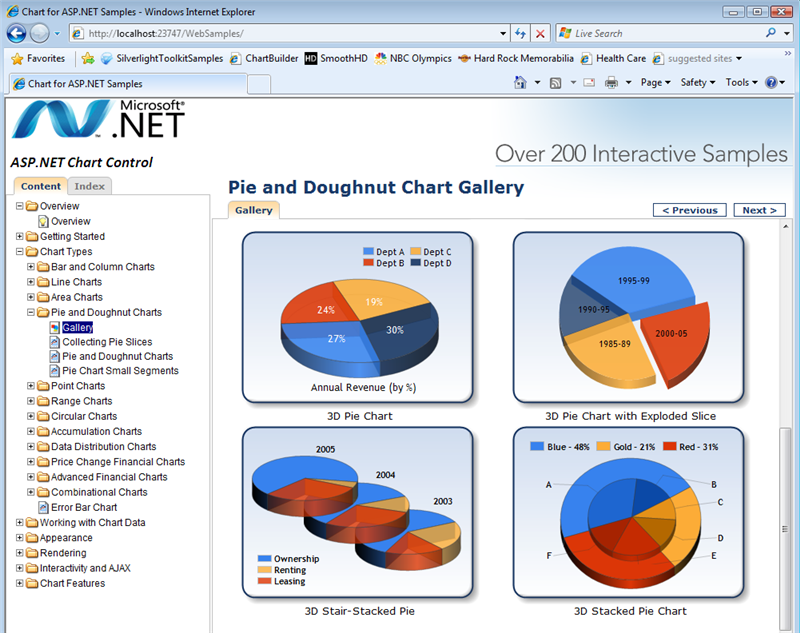
<asp:chart /> supports a rich assortment of chart options – including pie, area, range, point, circular, accumulation, data distribution, ajax interactive, doughnut, and more. You can statically declare chart data within the control declaration, or alternatively use data-binding to populate it dynamically. At runtime the server control generates an image (for example a .PNG file) that is referenced from the client HTML of the page using a <img/> element output by the <asp:chart/> control. The server control supports the ability to cache the chart image, as well as save it on disk for persistent scenarios. It does not require any other server software to be installed, and will work with any standard ASP.NET page.
To get a sense of how to use the <asp:chart /> control I recommend downloading the Microsoft Chart Controls Sample Project. This includes over 200 ASP.NET sample pages that you can run locally. Just open the web project in VS 2008 and hit run to see them in action – you can then open the .aspx source of each to see how they are implemented.
Resources
- New ASP.NET Charting Control: <asp:chart runat=”server”/> (Scott Gu)
- Microsoft Chart Control vs. Dundas Chart Control (Alex Gorev)
- Download the free Microsoft Chart Controls (Microsoft)
- Download the VS 2008 Tool Support for the Chart Controls (Microsoft)
- Download the Microsoft Chart Controls Samples (MSDN)
- Download the Microsoft Chart Controls Documentation (Microsoft)
- Visit the Microsoft Chart Control Forum (MSDN)